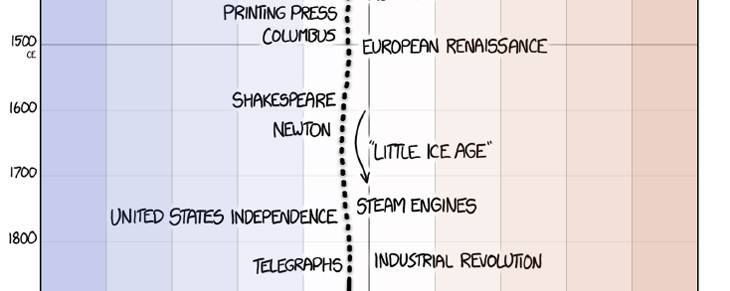
Sometimes, what it takes is a nice little illustration to put something in perspective, and Randall Munroe of xkcd is our man for this example. There is a ridiculous amount of propaganda around regarding climate change, with countless claims and excuses and pretty much just pitiful whining that it isn’t happening, or humans aren’t the cause of it, or the spikes are expected and part of a normal cycle, and on and on and on. In my experience, nobody ever sticks to just one argument, but jumps to the newest popular denial every time their previous one is shown to be horseshit – despite the fact that, in a lot of cases, the new argument is contradictory to their old one. Once they start saying that humans aren’t the cause, for instance, then they’re tacitly admitting that it is happening. In an ideal world, this would mean admitting that they were wrong, even just to themselves, and perhaps a careful examination of the evidence (or just the wish for evidence) that led them astray. However, like Jenny McCarthy and her stance on vaccines and autism, very often the details change routinely while the conclusion never wavers, which only tells us that there is a vested, emotional interest in the conclusion underneath everything, and whatever can be found to bolster it is seized upon as long as it still sounds good; once the majority of people begin to find it batshit, then it’s time for a new rationale. Which, in this as well as too many other cases, doesn’t bear any relation to rational.
Randall, however, did a simple little illustration of the infamous ‘hockey stick,’ the diagram of the sudden change in global average temperatures. And by the way, I need to emphasize that: Global. Average. Temperatures. A few cold days in our local winter, especially compared against last year or whatever, does not make or break a trend, and has infinitesimal bearing on the global climate overall. Funny, though, I kept listening all throughout the summer, but those arguments that we weren’t experiencing hotter temperatures somehow weren’t to be found. It’s amazing how little it takes to shut an idiot up…

Anyway, take a look at that chart, which is quite long just to illustrate the nature of periodic cycles, and ice ages, and all that. Sure, plenty of people will deny that it’s based on solid scientific studies and all that shit, because they have to – feel free to ask them which studies they’re dismissing, and over what details; none of them actually know. They don’t ever look at any studies whatsoever – their sources are virtually always some pundit, and they just repeat the same words without comprehension like a parrot. And with the same tendency to drop their shit all over the place.


